• Welcome to TalkWeather!
    We see you lurking around TalkWeather! Take the extra step and join us today to view attachments, see less ads and maybe even join the discussion.
    CLICK TO JOIN TALKWEATHER

2024 Atlantic Hurricane Season

JPWX

Member
Messages
1,522
Reaction score
4,132
Location
Smithville MS
I'm starting the 2024 Atlantic Hurricane Season thread. Below are my OWN thoughts based on what I'm seeing. Basically what I'm saying is I've done my research.

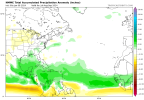
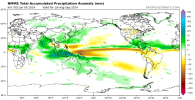
• THE OCTOBER, NOVEMBER, AND DECEMBER 2023 RUN'S OF THE CANSIPS MODEL SHOWS ANOTHER ACTIVE TO VERY ACTIVE HURRICANE SEASON. THIS MODEL HAS SERVED ME WELL SINCE I STARTED USING IT IN 2017.
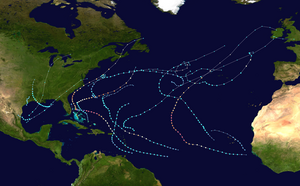
•IF THIS IS CORRECT, YOU WOULD SEE A PATTERN SIMILAR TO THAT OF 2017 AND OTHER BIG YEARS (04,05, ETC), LONG TRACKED CAPE VERDE HURRICANES AND ENHANCED RISK OF LANDFALLS FROM THE CARIBBEAN, GULF, AND SOUTHEAST U.S. (CAROLINAS TO FLORIDA).
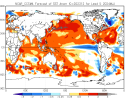
THE IDEA OF A TRANSITION BACK TO A LA NINA IS GROWING AND ALL 3 (OCTOBER-DECEMBER) OF THE CANSIPS RUNS SHOW THIS. A CENTRAL PACIFIC MODOKI BASED LA NINA.

HERE’S THE LIST OF MODOKI LA NINA’S:

•1973-74, 1975-76, 1983-84, 1988-89, 1998-99, 2000-01, 2008-09, 2010-11, AND 2016-17

•THE IDEA OF A TRANSITION BACK TO A LA NINA (MODOKI) IS ON THE TABLE. LEADING TO ANOTHER VERY TO EXTREMELY ACTIVE ATLANTIC HURRICANE SEASON THIS TIME WITH THE RETURN OF MULTIPLE CLASSIC CAPE VERDE LONG TRACKERS. (Something that's been missing since 2017)
•TOTAL STORMS: 12-25 (MY FORECAST MADE ON OCTOBER 1ST, 2023)
•HURRICANES: 8-16 (MY FORECAST MADE ON OCTOBER 1ST, 2023)
•MAJOR HURRICANES: 5-12 (MY FORECAST MADE ON OCTOBER 1ST, 2023)
•TOTAL ACE: 190 TO 230 RANGE (MY FORECAST MADE ON OCTOBER 1ST, 2023)
 

Attachments

  • cansips-all-avg-exatl-precip_anom_season_mostrecent-5148800.png 3.png
    cansips-all-avg-exatl-precip_anom_season_mostrecent-5148800.png 3.png
    95.8 KB · Views: 0
  • cansips-all-avg-exatl-precip_anom_season_mostrecent-2470400 (2).png
    cansips-all-avg-exatl-precip_anom_season_mostrecent-2470400 (2).png
    93.5 KB · Views: 0
  • cansips-all-avg-exatl-precip_anom_season_mostrecent-7200000.png
    cansips-all-avg-exatl-precip_anom_season_mostrecent-7200000.png
    90.8 KB · Views: 0
  • cansips-all-avg-exatl-sst_anom_season_mostrecent-0419200.png
    cansips-all-avg-exatl-sst_anom_season_mostrecent-0419200.png
    78.8 KB · Views: 0
  • cansips-all-avg-exatl-mslp_anom_season_mostrecent-0419200.png
    cansips-all-avg-exatl-mslp_anom_season_mostrecent-0419200.png
    94.6 KB · Views: 0
  • cansips-all-avg-exatl-z500_anom_season_mostrecent-0419200.png
    cansips-all-avg-exatl-z500_anom_season_mostrecent-0419200.png
    92.9 KB · Views: 0
  • cansips-all-avg-pac_whole-sst_anom_season_mostrecent-0419200.png
    cansips-all-avg-pac_whole-sst_anom_season_mostrecent-0419200.png
    46.1 KB · Views: 0
  • cansips-all-avg-exatl-precip_anom_season_mostrecent-7740800.png 4.png
    cansips-all-avg-exatl-precip_anom_season_mostrecent-7740800.png 4.png
    95.5 KB · Views: 0

wolfywise

Member
Messages
13
Reaction score
34
Location
West Virgina
As an update for this thread, climate forecasts for January have recently been released and thusfar indicate a transition to La Nina even more strongly. As an aside, the last two images attached show that the MDR is so anomalously warm that it compares to Late July climatology. With the -NAO expected to persist through February, I have a hard time seeing the excessive warmth in the Atlantic fading to any significant degree.
 

Attachments

  • nmme_sstaMean_nmme_month_atl_7.png
    nmme_sstaMean_nmme_month_atl_7.png
    65.1 KB · Views: 0
  • image0-3.jpg
    image0-3.jpg
    100.3 KB · Views: 0
  • 20240107_174950.png
    20240107_174950.png
    37.5 KB · Views: 0
  • 20240107_174947.png
    20240107_174947.png
    40.1 KB · Views: 0
  • 20240107_174944.png
    20240107_174944.png
    37.9 KB · Views: 0
  • 20240107_174937.png
    20240107_174937.png
    38.5 KB · Views: 0
  • nino34.png
    nino34.png
    76.9 KB · Views: 0
  • nmme_apcpna_multimonth_nmme_atl_7.png
    nmme_apcpna_multimonth_nmme_atl_7.png
    62.7 KB · Views: 0
  • nmme_sstaMean_nmme_month_global_7.png
    nmme_sstaMean_nmme_month_global_7.png
    81.4 KB · Views: 0
  • nmme_apcpna_multimonth_nmme_global_7.png
    nmme_apcpna_multimonth_nmme_global_7.png
    77.2 KB · Views: 0

wolfywise

Member
Messages
13
Reaction score
34
Location
West Virgina
Note: it seems theres a file limit per post. Here are the last two images I was talking about wrt MDR warmth now vs July climo.
 

Attachments

  • GDk1OFLXIAEUP6Z.jpg
    GDk1OFLXIAEUP6Z.jpg
    202 KB · Views: 0
  • crw_ssta_natl (1).png
    crw_ssta_natl (1).png
    409.5 KB · Views: 0

JPWX

Member
Messages
1,522
Reaction score
4,132
Location
Smithville MS

I'll be honest. Andy Hazelton may not be that off on that total ACE potential. The only other basin that typically runs near or around ACE that high is the Western Pacific.

Highest ACE total by basin:

Atlantic: 258.6 (1933)
East Pacific: 318.1 (2018) East Pacific ACE over 300 occurrence: 1 time
West Pacific: 570.4 (1997) West Pacific ACE over 300 occurrence: 25 times
North Indian Ocean: 46.1 (2007)
South Indian Ocean: 230.5 (1994)
South Pacific: 160.9 (1992)
 

Atlantic

Member
Messages
39
Reaction score
18
Location
Virigina
My prediction for the 2024 Atlantic Hurricane Season is:

17-19 named storms
6-10 hurricanes
5-8 major hurricanes
 
Messages
511
Reaction score
433
Location
Northern Europe
@JPWX Based on the analogs that you mentioned, climatology for transitions from moderate/strong +ENSO (El Niño) → moderate/strong -ENSO (La Niña) would suggest that the main threats in 2024 would be to the Caribbean, western Gulf Coast, and the Carolinas. If the subtropical Atlantic is as warm as depicted on some of the models as well, then maybe ridging will be farther north and/or weaker farther south, especially if the -NAO persists through the peak of the season, which would allow a lot of out-to-sea tracks as well as low-riding Caribbean cruisers.

Significant (Cat.-3+) Hurricane Impacts and/or Close Calls
1974: Carmen (C4 Caribbean, C3 LA)
1975: Caroline (C3 BoC/Mexico), Eloise (C3 FL Panhandle) + close call: Gladys (C4 off East Coast)
1976: Belle (C3 off East Coast, C1 over Long Island, NY)
1983: Alicia (C3 TX)
1984: Diana (C4 offshore, C1 at landfall in NC)
1988: Gilbert (C5 Caribbean/Mexico), Joan (C4 Caribbean/Central America)
1989: Hugo (C5 peak, C4 Caribbean/SC)
1998: Bonnie (C3 peak, C2 NC), Georges (C4 peak, C3 Caribbean, C2 FL Keys/MS), Mitch (C5 Caribbean, C1 Central America)
1999: Bret (C4 BoC, C3 TX), Floyd (C4 peak, C2 NC), Lenny (C4 Caribbean, C2/3 Leeward Islands)
2000: Keith (C4 Caribbean, TS Belize)
2001: Iris (C4 Caribbean/Belize), Michelle (C4 Caribbean/Cuba)
2008: Gustav (C4 Cuba, C2 LA), Ike (C4 Bahamas/Cuba, C2 TX), Omar (C4 Caribbean), Paloma (C4 Caribbean, C2 Cuba)
2010: Earl (C4 peak, C1 Canada), Igor (C4 peak, C1 Canada), Karl (C3 BoC/Mexico)
2011: Irene (C3 peak, C1 NC), Rina (C3 Caribbean, TS Yucatán Peninsula)
2016: Matthew (C5 peak, C4 Haiti/Cuba, C1 SC), Nicole (C4 peak, C3 Bermuda), Otto (C3 Central America)
2017: Harvey (C4 TX), Irma (C5 Leewards, C4 Bahamas/Cuba/FL Keys), Maria (C4/5 Caribbean islands)

Since 2016 most of the Gulf Coast has already seen fairly evenly-spaced hurricane impacts from South TX to St. Marks, FL, so most of this region is hardly “due” for another round in 2024 (I excluded some marginal and/or questionable hurricanes, i.e., 2019 Barry, 2017 Nate, and 2021 Nicholas, and chose storms whose intensities are confirmed by surface observations as well as satellite and reconnaissance):

2016: Hermine (NW FL)
2017: Harvey (TX)
2018: Michael (NW FL)
2020: Hannah (TX), Laura (LA), Sally (AL), Delta (LA), Zeta (LA)
2021: Ida (LA)

I did some personal research on past climatology, came up with my own estimations of storms’ intensities in some cases, and came to some interesting conclusions. From 1926–94 the average return-rate of Cat.-4+ impacts on the U.S. mainland was once/~3 (during +AMO of 1926–69)–5 (during -AMO of 1970–94) yr. During the most recent +AMO of 1995–present the return-rate was just once/~11 yr. There were 23 Cat.-4+ LF from 1926–94, 13 of which were 120+ kt / 140+ mph at impact, but at most two from 1995–present, both of them 120+ kt / 140+ mph (2004 Charley and 2005 Katrina—officially the latter was C3 at LF in LA, but personally I agree with the NHC’s operational C4 estimate). I excluded Michael, Laura, and Ida because abundant in-situ observations of wind speed on land, along with structural-damage surveys from StEER, did not really justify winds of 120+ kt / 140+ mph at landfall.

So the most recent +AMO has produced far less frequent Cat.-4+ landfalls on the U.S. than either the previous +AMO or the previous -AMO did. I also found the following resource and found it to be interesting. According to Professor David Dilley, a cold (-) PDO is likely to emerge from 2024 on, last approximately three to four decades, and end c. 2055 (1981–2023 was a warm, + PDO). The current +AMO is to last through 2033, with a -AMO to commence the following year and last until c. 2074. From 2024–32 the Professor expects hurricanes to impact areas of U.S. that have been spared between 2016–23. As the original poster mentioned, a lot of recent seasons (since 2005/’10 in my estimation) have been lacklustre in terms of Cabo-Verde long-trackers, which tend to produce a significant proportion of ACE. So we have seen fewer “hyperactive” seasons after vs. before 2005/’10. Will this change?


I also read on another forum the belief of a reputable contributor that from 2015–34 a minimum of four to five large, Cat.-4+ hurricanes would impact each of the following areas: West Palm Beach, Fort Lauderdale, Miami, and the Keys (including Key West). So will the seasons 2024–34 somehow find a way to make up for the recent dearth of high-ACE seasons (other than 2017 and 2020) and at a breakneck speed generate a more “normal” rate of Cat.-4+ and ≥ 120-knot / ≥140-mph landfalls on the U.S. mainland, compared to past climatological cycles, especially for an ongoing +AMO? If we are indeed entering a period of global cooling, then perhaps we might see more-intense hurricane seasons once more, given that previous cooler periods in Earth’s history (i.e., the nineteenth century through the mid-twentieth century) seemingly saw more active hurricane seasons in general.
 
Messages
511
Reaction score
433
Location
Northern Europe
2022-Dec-AMOchange.png


Also, on the OISST maps the pattern looks more like that a classic +AMO than has been seen in the past six winters. During a -AMO the warm “horseshoe” would form an arc from the Labrador Sea to the Sargasso Sea. This time that region is cooler vs. recent winters, while the AMO region from south of Iceland to the Canaries and the MDR is warmer. If we are entering into a cooler period worldwide then the ice-melt may reverse and allow the +AMO to recover for some years. Will 2024 and subsequent seasons make up for the dearth of “hyperactivity” ACE-wise since at least 2010?
 
Messages
511
Reaction score
433
Location
Northern Europe
This forecaster has a fairly reliable record and highlights northern Tamaulipas, South TX, and the east coast of FL (from the upper Keys north) in 2024, suggesting the possibility of hurricane-related impacts in these areas. I looked up some past seasons since 1926 that a) featured hurricane impacts in both N MX/S TX and E FL; and b) transitioned from neutral or +ENSO to -ENSO. I used SST-related data from a multiple sources and managed to locate at least three seasons (bolded) that could serve as possible analogs for 2024, based on the aforementioned forecast.

1929: neutral -> weak +ENSO, +PMM
Notable storms: Cat. 1 in S TX, Cat. 3 in the upper FL Keys

1933: neutral -> MDT -ENSO, -PMM
Notable storms: Cat. 1 in N MX, Cat. 3 in S TX, Cat. 3 in SE peninsular FL

1936: neutral -> neutral, +PMM
Notable storms: Cat. 1 in S TX, strong TS in S peninsular FL (hit FL Panhandle as Cat. 2)

1941: MDT +ENSO -> MDT +ENSO, +PMM
Notable storms: Cat. 3 in S TX, Cat. 2 in SE peninsular FL

1945: neutral -> neutral, neutral PMM
Notable storms: Cat. 3 in S TX, Cat. 4 in SE peninsular FL

1949: neutral -> weak -ENSO, neutral PMM
Notable storms: Cat. 4 in SE peninsular FL, Cat. 2 in S TX

1964: MDT +ENSO -> weak -ENSO, -PMM
Notable storms: strong TS (possible hurricane) in S TX, Cat. 2 in SE peninsular FL, Cat. 2 in NE peninsular FL (+ Cat.-1 impact on SE peninsular FL from W in October)

Currently the climate-models suggest that 2024 may feature a moderate or strong -ENSO yet also coincide with a +PMM. Last season the impact of the strong +ENSO was blunted by the fact that it coincided with a -PMM, so the conditions in the Atlantic were more typical of neutral or even weakly -ENSO, hence all the activity in the deep tropics. Maybe the +PMM in 2024 would cancel the -ENSO and result in neutral-like conditions over the Atlantic during the peak of the season. So in effect the atmosphere over the Atlantic may be transitioning from neutral to neutral in 2024.
 

Atlantic

Member
Messages
39
Reaction score
18
Location
Virigina
So I had a theory that where a bunch of invests fail to form in the previous year, that's where the hot spot for development would be the next season. So the Atlantic's MDR was pretty dead in 2022 but was very active in 2023. The Gulf of Mexico and Carribean Sea failed to really be active in 2023 but I forecast that the hot spots will be those areas in the upcoming 2024 season.
 

JPWX

Member
Messages
1,522
Reaction score
4,132
Location
Smithville MS
So I had a theory that where a bunch of invests fail to form in the previous year, that's where the hot spot for development would be the next season. So the Atlantic's MDR was pretty dead in 2022 but was very active in 2023. The Gulf of Mexico and Carribean Sea failed to really be active in 2023 but I forecast that the hot spots will be those areas in the upcoming 2024 season.
Same. That's what I'm thinking as well
 

Atlantic

Member
Messages
39
Reaction score
18
Location
Virigina
2016 could be a analog to 2024 as it was a season following up on the Super El Nino of 2014-16, which was largely diapating by the beginning of the 2016 season.

2016 ended up totaling 15 named storms by season's end.
undefined

However it is to note that 2016 was followed up by a very destructive 2017 season which was had a cool neutral that later progressed to a La Nina.

You also have 2019, which was a +ENSO left over from 2018 transitioning to a -ENSO later in the year (The 2018-19 El Nino diapated in August 2019). 2019 totaled 18 named
storms:

300px-2019_Atlantic_hurricane_season_summary.png
 
Messages
511
Reaction score
433
Location
Northern Europe
So I had a theory that where a bunch of invests fail to form in the previous year, that's where the hot spot for development would be the next season. So the Atlantic's MDR was pretty dead in 2022 but was very active in 2023. The Gulf of Mexico and Caribbean Sea failed to really be active in 2023 but I forecast that the hot spots will be those areas in the upcoming 2024 season.
Those two regions have generally seen a lot of activity since 2016. The Caribbean was active in 2016, 2017, 2020, 2021, and 2022. The Gulf was active in every season. By comparison the East Coast, including the east coast of Florida, has seen much less active than the Caribbean and Gulf during the past several seasons. Owing to recent trends people naturally become accustomed to numerous Gulf-area impacts, year after year. At some point I would expect the pattern to change.

If anything may work to limit 2024’s ceiling, it will be the Newfoundland warm pool. This has been a near-perennial feature since the early 2010s, and has contributed to a lot of stability in the tropical Atlantic. As CSU’s verification revealed, 2023 featured record-low sea-level pressures, near-record-high SSTs, and near-record-low shear in the tropical Atlantic. However, most of the storms to develop there ended up being weak, owing to stable air from the subtropics and polar regions.

I suspect that the Newfoundland warm pool is a feature of the warming Arctic and associated ice-melt. We have been in a warmer epoch over the past several decades. If we are indeed entering a cool cycle, then I would suspect that the Greenland ice-melt would start to reverse, allowing the +AMO to strengthen at the expense of the Newfoundland warm pool. This will be the key to a hyperactive and/or “record-breaking” 2024 Atlantic hurricane season, in my view.
 

Atlantic

Member
Messages
39
Reaction score
18
Location
Virigina
Those two regions have generally seen a lot of activity since 2016. The Caribbean was active in 2016, 2017, 2020, 2021, and 2022. The Gulf was active in every season. By comparison the East Coast, including the east coast of Florida, has seen much less active than the Caribbean and Gulf during the past several seasons. Owing to recent trends people naturally become accustomed to numerous Gulf-area impacts, year after year. At some point I would expect the pattern to change.

If anything may work to limit 2024’s ceiling, it will be the Newfoundland warm pool. This has been a near-perennial feature since the early 2010s, and has contributed to a lot of stability in the tropical Atlantic. As CSU’s verification revealed, 2023 featured record-low sea-level pressures, near-record-high SSTs, and near-record-low shear in the tropical Atlantic. However, most of the storms to develop there ended up being weak, owing to stable air from the subtropics and polar regions.

I suspect that the Newfoundland warm pool is a feature of the warming Arctic and associated ice-melt. We have been in a warmer epoch over the past several decades. If we are indeed entering a cool cycle, then I would suspect that the Greenland ice-melt would start to reverse, allowing the +AMO to strengthen at the expense of the Newfoundland warm pool. This will be the key to a hyperactive and/or “record-breaking” 2024 Atlantic hurricane season, in my view.
Oh god, please not another 2020. We don't need 30+ named storms. Why is the Atlantic trying so hard to become another Western Pacific. On a side note, both 2005 and 2020 had a rare storm near Spain.
 

JPWX

Member
Messages
1,522
Reaction score
4,132
Location
Smithville MS
The way I see it. 2024 will be near or above amount of 2020 in terms of number of total systems and impacts. But this time with long tracked/intense systems as we saw in 04, 05, 08, and 17.
 

Atlantic

Member
Messages
39
Reaction score
18
Location
Virigina
The way I see it. 2024 will be near or above amount of 2020 in terms of number of total systems and impacts. But this time with long tracked/intense systems as we saw in 04, 05, 08, and 17.
So more than 30 named storm then?
 

Atlantic

Member
Messages
39
Reaction score
18
Location
Virigina
The way I see it. 2024 will be near or above amount of 2020 in terms of number of total systems and impacts. But this time with long tracked/intense systems as we saw in 04, 05, 08, and 17.
Imagine if we get another set of sub-890 mb storms like the pair that was 2005's Rita (885 mbs) and Wilma (882 mbs)
 

JPWX

Member
Messages
1,522
Reaction score
4,132
Location
Smithville MS
So more than 30 named storm then?
Definitely could give 2020 a run for it's money in that regard. Fact is each season we've tended to have more named storms due to better satellite data, etc. Not necessarily due to ahem warming as everyone and their cousins seem to believe. Also if you look at the last 5 or 6 years, the Western Pacific numbers have been low compared to normal especially the typhoons/super typhoons. Rule of thumb is when the western Pacific is inactive, the Atlantic is more active. Plus also we've been in either La Nina, Neutral, or weak El Nino conditions since 2017. That combined with the warmth in the Atlantic has led to above normal activity. You look at 2020 for example. Out of the 31 total systems, none became category 5 hurricanes (though one could argue at least one did) In fact, the Western Pacific basin has not had a total ACE of more than 300 since 2018 and their last ACE of more than 400 was in 2015. That was mostly due in part to the Super El Nino that year.
 
Messages
511
Reaction score
433
Location
Northern Europe
The way I see it. 2024 will be near or above amount of 2020 in terms of number of total systems and impacts. But this time with long tracked/intense systems as we saw in 04, 05, 08, and 17.
At this point, I remain skeptical of high-end ACE in 2024, no matter how conducive most factors may be, unless and until the Newfoundland warm pool cools down. As long as it persists, we will continue to see dry air over the Caribbean and most of the MDR (except very near West Africa) that reduces the number of high-ACE storms and caps potential intensity. 2023 proved this. If not for the Newfoundland warm pool and stability in the tropical Atlantic, we could have seen ACE well north of 160, maybe even close to 200, given how favourable all the other atmospheric factors were. We need to enter a period of cooling temperatures in the Arctic to reverse recent sea-ice melt and rebuild the recent +AMO, for instance. A Newfoundland warm pool is the opposite of what one should see during a +AMO “horseshoe.”

NWP-1.png

NWP-2.png


Definitely could give 2020 a run for it's money in that regard. Fact is each season we've tended to have more named storms due to better satellite data, etc. Not necessarily due to ahem warming as everyone and their cousins seem to believe.
We have also seen looser standards of classification over the past few decades. Many questionable systems have been upgraded to TS status (often moderate or strong) despite having pressures and satellite-presentations that would suggest weaker winds. Even past NHC directors from the old days (Dr. Neil Frank et al.) have said that many of these systems shouldn’t have been upgraded. And even the hurricanes seem to be inflated. For example, last year’s Tammy was classified as a 75-knot/85-mph hurricane near the Caribbean, despite having an unusually high pressure, in the low 990s mb, and the fact that no Caribbean station, even near the eye, reported reliable winds of TS or stronger strength. A station on Barbuda, which received a direct hit, did report hurricane-force winds, but numerous stations nearby reported winds of less than TS force, which makes the official “hurricane” designation seem rather ludicrous. But this is just my unprofessional opinion. In my view pre-satellite seasons outside El Niño with a high hurricane:storm ratio likely had higher ACE than 2005 and more storms than 2020, i.e., 1933. We just lacked satellites to verify this.

And many of the big landfalls on the U.S. since 2016 seem to have been overestimated vs. similar storms in the past. A look back at storms from the 1920s through the early 1990s shows that very many had confirmation of their intensity from land-based stations and/or wind-caused damage, plus radar- and station-derived estimates of RMW supplemented by storm-surge readings. Regardless of what some people may think, there were plenty of in-situ observations early on that confirmed extreme winds. For example, many of the Cat.-4 storms that hit FL in the 1940s had official and unofficial observations of Cat.-5 or near-Cat.-5 gusts (≥ 130 knots / 150 mph), and later Cat.-4+ storms such as Audrey, Donna, Carla, Betsy (in LA), Camille, Celia, Eloise, Frederic, and so on, whether officially classified as such at landfall or not, were similarly supported. By contrast, the only evidence to support the Cat.-4+ estimates at landfall in the U.S. for Harvey, Irma, Michael, Laura, and Ian comes from aircraft and radar. There were numerous land-based observations and structural surveys that did not support anything higher than Cat-3 status in these cases.

My question is, from 2024 on, will we start seeing Cat.-4+ U.S. landfalls whose status is actually backed up by land-based data, that is, real, indisputable Cat.-4+ hits?
 

Atlantic

Member
Messages
39
Reaction score
18
Location
Virigina
My calls on the storm tracks of August, September and October 2024:

Screenshot 2024-01-24 11.43.38 AM.pngScreenshot 2024-01-24 11.50.47 AM.pngScreenshot 2024-01-24 11.55.02 AM.png
I can't make enough since of November to include it here.
 
Back
Top